
Google defined fast shipping
🚚 Google now says how fast “fast shipping” is country by country, Meta expands AI-powered ads, updates commercial terms and adds new Reels tools, and more!

Hey there Smarty 👋
Are you geared up to catch the latest and greatest in quick shorts?
And just a quick heads-up! If you stumbled upon us through a friend, make sure to subscribe here! That way, you’ll never miss out on the trending shorts.

🚚 Google now says how fast "fast shipping" is, country by country
On October 21, Search Engine Roundtable reported that Google's Merchant Center documentation now states how many days a listing needs to qualify for fast shipping in each market:
- Japan and New Zealand: 1 day
- India: 2 days
- United States, United Kingdom, Canada and Australia: 3 days
- Brazil: 4 days
That gives every store selling through Google a clear target. Whether you hit it depends on two numbers in your shipping settings: handling time and transit time.
Step 1: Add up your real delivery days
For each country you ship to, write down:
- Handling time: days from order to dispatch
- Transit time: days from dispatch to the customer's door
A US store that ships next day with two-day ground transit totals three days, right at the line. One that needs two days to pack and ships ground in three totals five.
Step 2: Close the gap where it's cheapest
Cut handling time first. Moving dispatch from two days to one often costs less than paying for faster carriers. Look at pick-and-pack staffing and order cutoff times.
Set an order cutoff time. Orders placed late in the day usually ship the next day. Stating a realistic cutoff keeps delivery estimates honest.
Use regional transit times. If most of your customers sit near your warehouse, setting transit by region can show faster delivery to the shoppers who'll actually get it.
Step 3: Stay honest in November
Carriers slow down around Black Friday. If your real delivery time stretches, update handling or transit settings to match. In my judgment, a delivery promise you miss in peak week does more harm than a slower promise you keep.
Step 4: Prioritize your fastest products
If only some products ship fast, such as in-stock items from your main warehouse, give them more prominence in Shopping campaigns during the holiday weeks. Products with long lead times or made-to-order items are better left out of the fast-shipping push.
Step 5: Check by country
If you sell abroad, run the same math for each market. A store that qualifies at home may miss Canada's 3-day line because of cross-border transit.
What to track
- Share of products that meet each country's threshold
- Actual delivery days against the stated estimate
- Shopping conversion rate before and after any change
Your first check
Open your Merchant Center shipping settings and add handling time to transit time for your main market. If the total is above the line, start with handling time.
Together with Insense
Your BFCM Creator Calendar is Already Mapped
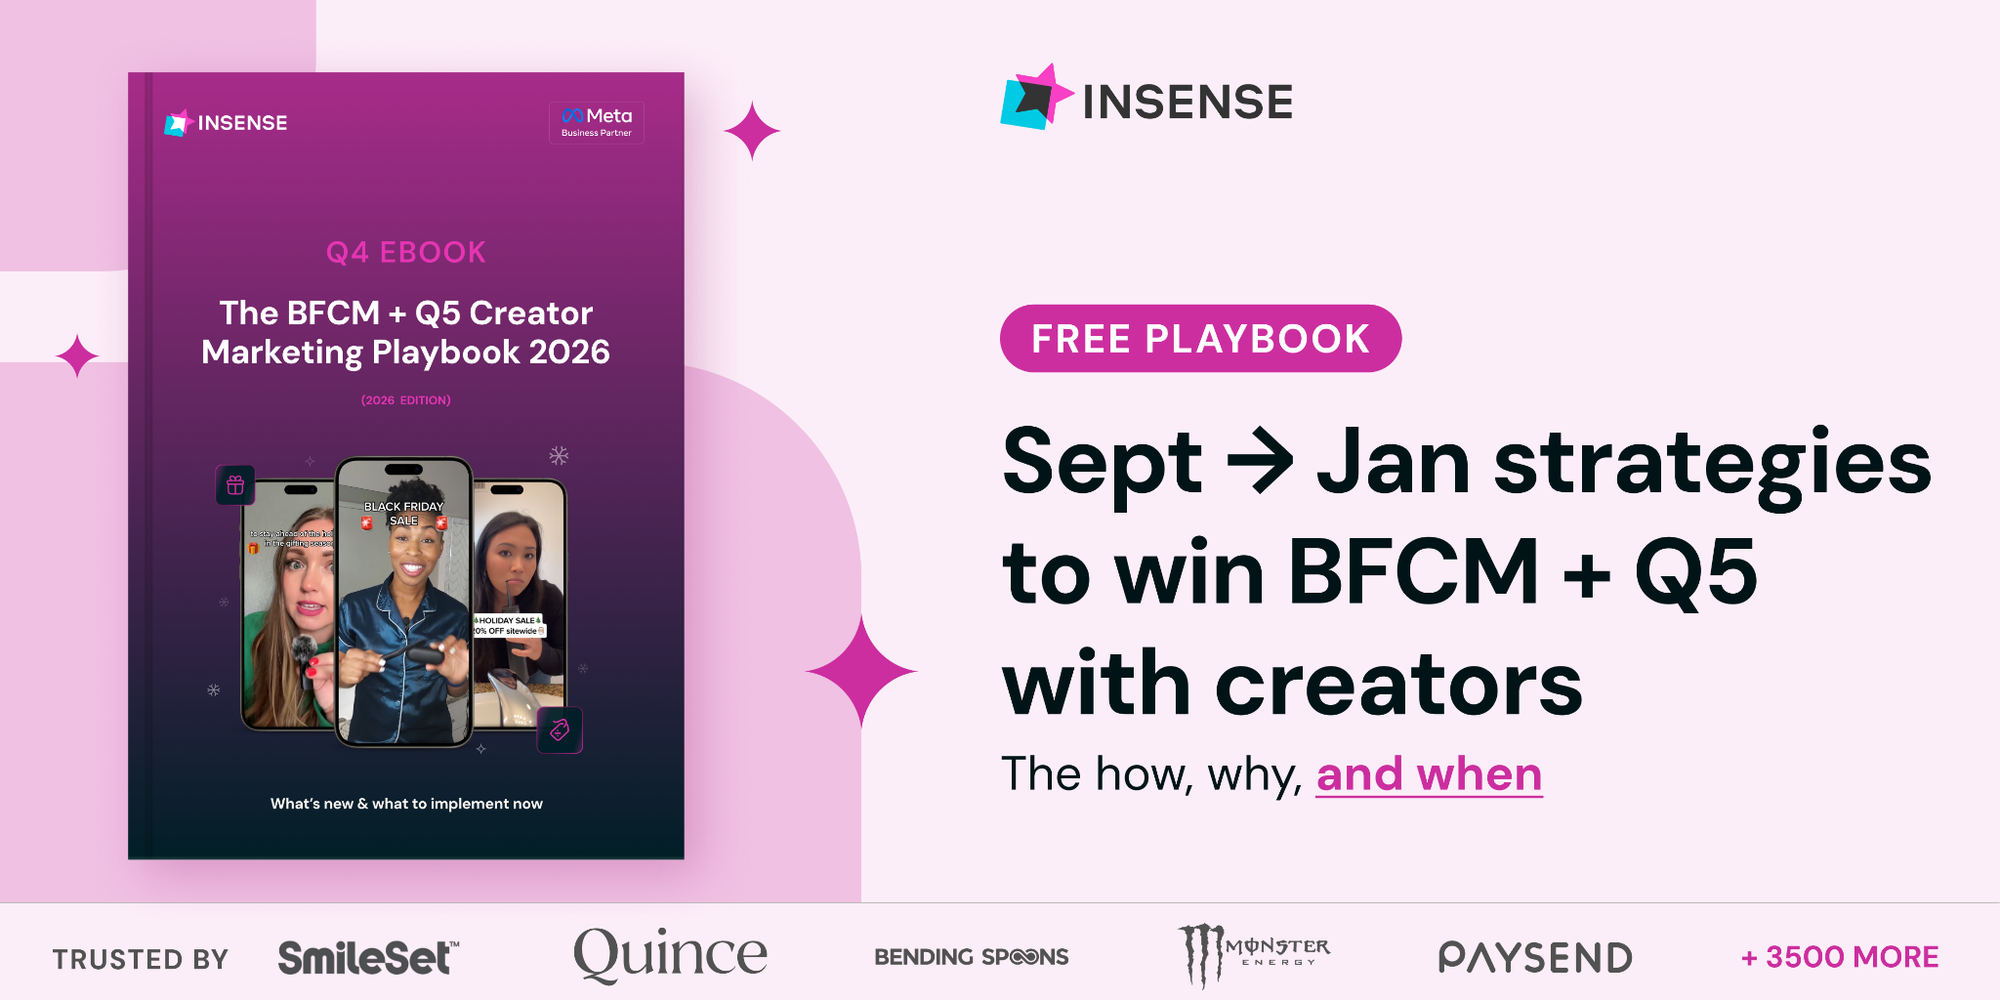
Still sourcing creators when your Black Friday ads should be running? Every delay leaves less time to test what actually sells before your biggest spending weeks.
Insense’s free BFCM + Q5 Creator Marketing Playbook gives marketers a week-by-week plan from September through January, so every creator campaign starts with a clear deadline and purpose.
Inside, you’ll find:
- A week-by-week August-to-January calendar showing when to secure permissions, test content, scale winning creators, and move into Q5.
- A practical creator scorecard using conversions, engagement quality, and reliability, so November budgets back proven performers over follower counts.
- Q5 action plan covering licence extensions, January creative, and the recommended 10–15% budget reserve for the lower-cost post-holiday window.
You’ll also get benchmarks for creator-handle ads, modular UGC testing, live shopping, hook rates, and creative volume, helping your team set measurable targets before spending rises.
📢 Meta expands AI-powered ads, updates commercial terms and adds new reels tools
Meta is introducing new product browsing and AI-generated landing page experiences across Facebook and Instagram, while updating its commercial terms and expanding video creation tools for creators.
The Breakdown:
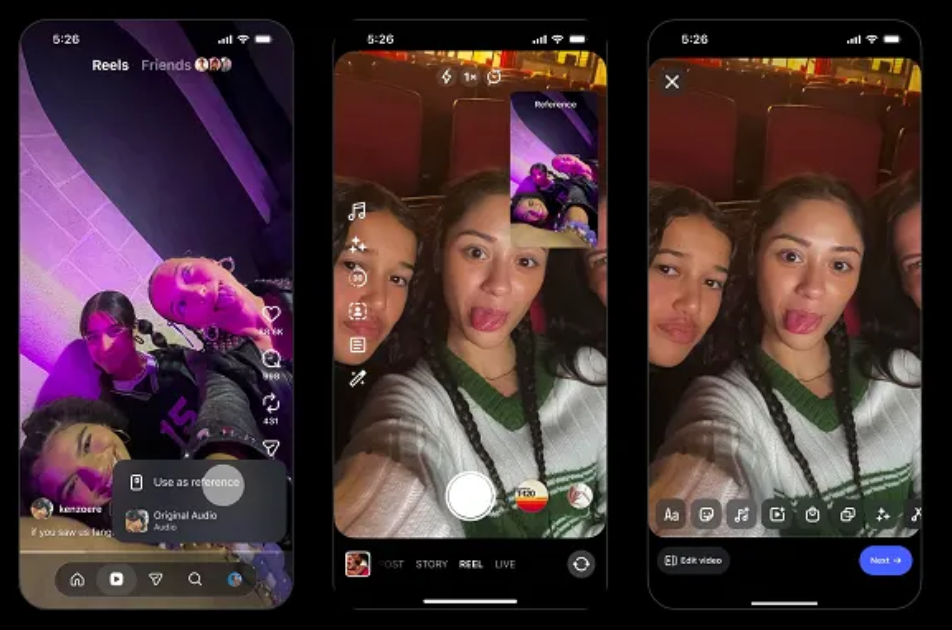
Instagram Adds Reels Creation Tools - Meta's Edits app now supports clickable audio links, audience trend insights, and reusable style kits. Instagram also introduced reference Reels for iOS creators while removing linked Reels series starting October 28.
Meta Makes In-App Product Browsing Default - Starting October 28, Meta will automatically enable personalized product browsing pages for eligible ads unless advertisers opt out. A test involving 117,000 advertisers showed an average 3% increase in conversions.
AI-Generated Landing Pages Raise Tracking Concerns - Meta is testing AI-generated landing pages on fewer than 5% of ad impressions. Because these pages operate outside advertisers' websites, standard GA4 and Meta Pixel tracking may miss user activity and create attribution gaps.
Meta's New Terms Raise AI Training Questions - From October 30, Meta's updated terms could allow AI training on business-linked website content. Meta says its crawling practices and existing protections remain unchanged.
Meta's updates are bringing more product discovery and creative activity inside its platforms, potentially giving advertisers new conversion opportunities while complicating independent measurement. Businesses should review browsing settings, verify conversion tracking, and understand the updated commercial terms before the changes take effect.
👨💻 Quick Hits
📱 Meta reported record Instagram engagement, with Reels watch time up 4%. Facebook Reels grew double digits, while Threads surpassed X in monthly users and reached 500 million users.
🎨 Google added brand management tools to Gemini, allowing businesses to generate consistent marketing visuals, analyze financial data, and access audience insights through integrations with Google services and third-party apps.
🛍️ Meta says shopping is Muse AI’s leading use case, with over 25% of users seeking purchase assistance. Average purchases exceed $200, while daily usage reaches 25% of activated users.
🔎 A Semrush study found Google AI Overviews appeared for 88% of tracked commercial keywords, up from 45.75% in September 2025. Review searches and e-commerce recorded the largest increases.
That’s a wrap for today! Tell us your thoughts about today's content as we line up more Shorts! And don’t hesitate to share this with someone who’d adore it. 🥰