The Post-Purchase Interrogation
🥹Turning Order Tracking Pages into Data Goldmines

Hey there Smarty 👋
Are you geared up to catch the latest and greatest in quick shorts?
And just a quick heads-up! If you stumbled upon us through a friend, make sure to subscribe here! That way, you’ll never miss out on the trending shorts.

🗣️The Post-Purchase Interrogation: Turning Order Tracking Pages into Data Goldmines
Most brands treat post-purchase pages as transactional updates—a bland list of shipping milestones. But what if this overlooked touchpoint could become your secret weapon for customer retention, product innovation, and hyper-personalized marketing?
The average customer visits their tracking page 3-5 times before delivery. That’s 3-5 chances to gather insights, build loyalty, and turn satisfaction into advocacy.
The Opportunity: Three Ways to Mine Gold from Post-Purchase Pages
1. The "Post-Purchase Confessional" Quiz
After confirming their order is shipped, prompt customers with a quick, reward-driven survey:
- “Take a 30-second quiz to improve your next order (and earn 15% off!).”
- Ask hyper-specific questions:→ “What almost stopped you from buying today?”→ “Was this purchase for you or someone else?”→ “Rate your checkout experience: Smooth or stressful?”
Why it works: Customers are most honest after buying. A 2022 Baymard Institute study found post-purchase surveys have a 42% higher completion rate than pre-checkout polls.
2. Conditional Discounts for Honesty
Embed a scratch card-style game on the tracking page:
- “Scratch to reveal your reward!Answer one question to unlock it: What’s one feature we’re missing?”
- Reward options: Free shipping on their next order, early access to sales, or bonus loyalty points.
Psychology hack: Gamification + instant gratification = 58% more feedback submissions (Journal of Marketing Research).
3. The "Upsell Autopsy"
Use the tracking page to subtly test future offers:
- “While you wait… Which product should we launch next?”→ Display 2-3 mockups (e.g., a new flavor, color, or bundle).→ Track clicks to gauge demand before production.
Case Study: A skincare brand tested three serum concepts this way, using tracking page data to prioritize their R&D. The winning product generated $1.2M in pre-orders.
The Ethical Rules of Engagement
- Transparency: Disclose how data will be used (e.g., “Your answers help us improve—never spam”).
- Opt-Outs: Let users skip questions without penalty.
- Anonymize: Aggregate sensitive feedback (e.g., pricing complaints) to protect privacy.
The Data Dividend
- Reduce Returns: Spot trends like “Size ran small” to adjust product descriptions.
- Predict Churn: Customers who report checkout friction are 3x more likely to abandon future purchases.
- Fuel Personalization: Use gift-purchase data to trigger holiday campaigns (“They loved your last gift—here’s what to send next”).
The Bottom Line
Your order tracking page isn’t a dead end—it’s a focus group that customers voluntarily revisit. By transforming it into a two-way conversation, you gain actionable insights while making shoppers feel heard. The post-purchase phase is where loyalty is won or lost. Interrogate wisely.
🤖 Google AI Overviews Reshape Search Visibility
Insights from Authoritas
A new study analyzing 10,000 keywords reveals how Google’s AI Overviews (AIOs) are changing search results, dominating problem-solving searches, pushing organic results lower, and prioritizing authoritative sources over user-generated content.
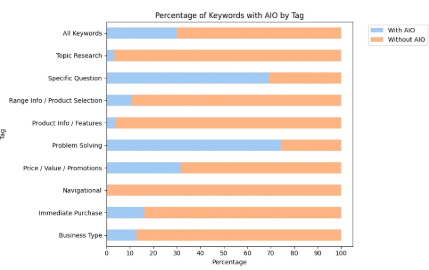
The Breakdown:
- AI Overviews Appear in 30% of Searches – AIOs showed up in 29.9% of searches but made up just 11.5% of total search volume. They are more common in mid-volume keywords (42%) than in high-traffic queries.
- Problem-Solving & Non-Brand Queries Trigger AIOs – AIOs appeared in 74% of problem-solving and 69% of question-based searches. Telecom led with 56% AIO presence. 33.3% of non-brand searches triggered AIOs, compared to 19.6% of brand-related queries.
- AI Overviews Push Organic Listings Down – Clicking “Show more” moves desktop results down by 220 pixels, reducing visibility for traditional rankings. On mobile, only 1-2 organic results are visible before scrolling.
- Trust & Authority Matter – High-ranking pages and Featured Snippets have a greater chance of appearing in AI Overviews, but only trusted, authoritative sources like finance and health are consistently included.
Google is prioritizing trusted, research-driven content in AIOs, sidelining traditional rankings. Brands must optimize for Featured Snippets, E-E-A-T, and non-brand queries to stay competitive as Google shifts toward AI-driven answers.
🎯 Quick Hits
❓ Tired of Sifting Through Thousands of Influencers? Insense’s vetted marketplace of 60,000+ UGC creators makes finding the right match effortless. Nurture Life reduced UGC turnaround from 2 months to 2 weeks, and Particle for Men doubled ROAS. Book a free demo call by Feb 14 & claim your $200 bonus!
🧵Threads is stepping up its game by adding a much-requested "Media" tab” to user profiles. Announced by Threads chief Adam Mosseri, this new feature will display all photos and videos a user has posted something X already has and Bluesky recently introduced.
🗞️ LinkedIn is broadening its test of a news banner in the mobile app, which highlights trending stories above the main feed.The feature, shared by social media expert Lindsey Gamble, provides a rotating summary of top news, making it easier for users to stay informed.
📄 LinkedIn reports “record engagement” again, though actual active users are estimated at 400 million despite 1 billion members. Revenue grew 9%, driven by ads, AI tools, and Premium subscriptions surpassing $2 billion. Video content is the biggest growth driver, with its immersive video feed seeing 36% usage growth last year.
That’s a wrap for today! Tell us your thoughts about today's content as we line up more Shorts! And don’t hesitate to share this with someone who’d adore it. 🥰